
In previous articles, we talked a lot about solar PV production, EMS, surplus diversion and MQTT. But before investing in panels, a battery or automations, there is one step that is all too often skipped: knowing exactly how much your home consumes, and where.
The good news: there is no need to put a meter on every socket. With one energy meter in the consumer unit and 2 or 3 smart plugs with metering, moved from appliance to appliance over a few days, you get a very reliable estimate of each area of consumption.
The aim of this article: measure, work out your baseload and your main areas of consumption, then see which solutions really make sense in your home.
The main areas of consumption in a home
In a household with electric heating or appliances, you will usually find:
- Electric heating: often the largest item, concentrated in winter;
- Domestic hot water: the electric water heater runs all year round;
- Refrigeration: fridge, freezer, wine cooler…;
- Laundry and dishes: washing machine, tumble dryer, dishwasher;
- Cooking: oven, hob, microwave;
- Entertainment and IT: TV, broadband router, computers, consoles;
- Lighting: relatively low since LEDs became widespread;
- The baseload: everything that draws power permanently, 24/7.
Some items are visible: you know when you start a wash. Others are far less so. That is exactly what measuring will reveal.
The equipment: very little is needed
| Tool | What it measures | What it is for |
| 🏠 Utility smart meter | Overall consumption, in 30-minute intervals | A free first overview, with nothing to install |
| ⚡ Energy meter in the consumer unit (SEM-4-1-00) | Instantaneous power for the whole home | Monitor the home in real time, calculate the baseload, measure "by difference" |
| 📊 3-circuit meter in the consumer unit (SEM-4-3-20) | The consumption of 3 separate circuits | Continuously track large fixed loads: water heater, hob, oven, garage sockets… |
| 🔌 2 to 3 smart plugs with metering | The consumption of a plugged-in appliance | Work through the appliances one by one |
| 🔧 Multifunction module with metering (SIN-4-1-21) | The consumption of a fixed appliance, which it also controls | Measure and control a water heater, a boiler, a pool filtration pump… |
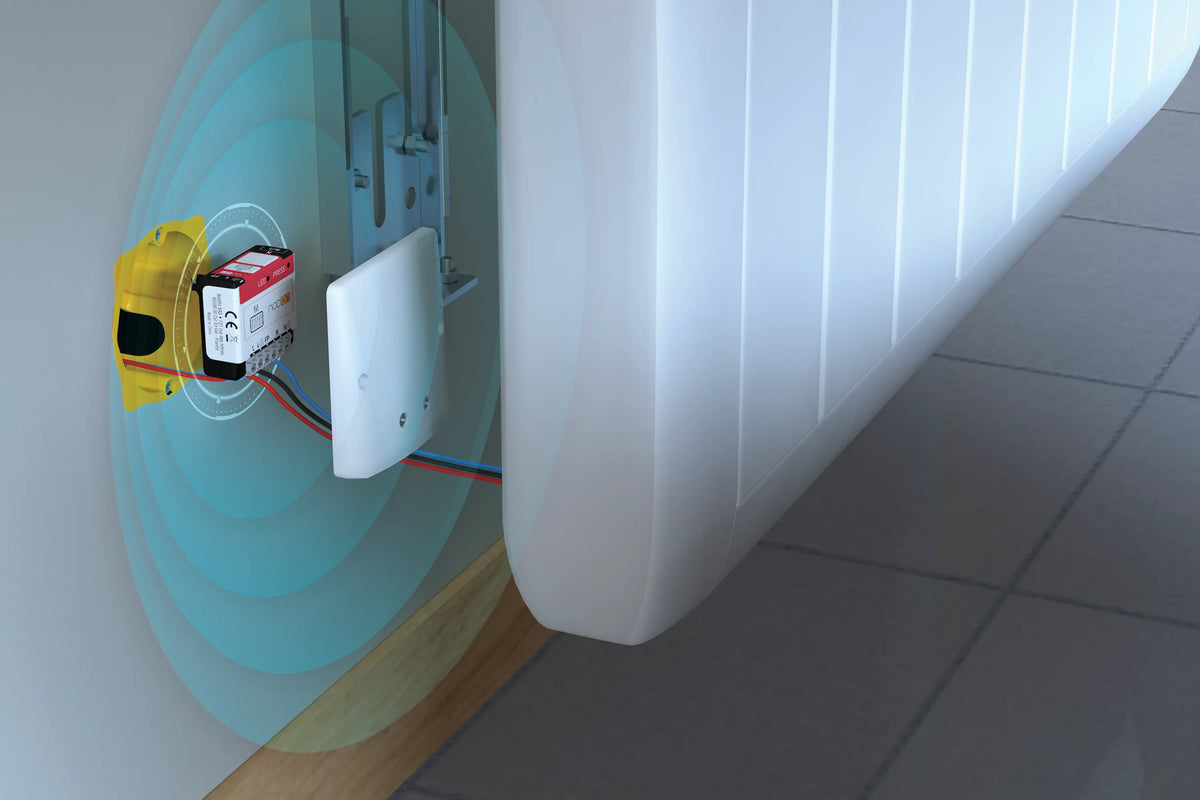
| 🔥 Pilot wire module with metering (SIN-4-FP-21) | The consumption of an electric radiator | Control pilot wire radiators and see the energy used room by room |
For the plugs, there are several options depending on your installation:
- With a Zigbee home automation system, a smart plug with metering reports its values directly to Home Assistant or any other controller;
- With EnOcean products, the Micro Smart Plug + Metering (MSP-2-1-01) does the same job, and integrates easily thanks to NodOcean for HA;
- To get started without home automation, a Wi-Fi smart plug with metering and its app are enough to take readings.
Step 1: measure the whole home
The first thing to do: look at overall consumption.
- With the smart meter: your energy supplier's online account or app shows the load curve. Remember to enable half-hourly data collection if you haven't already.
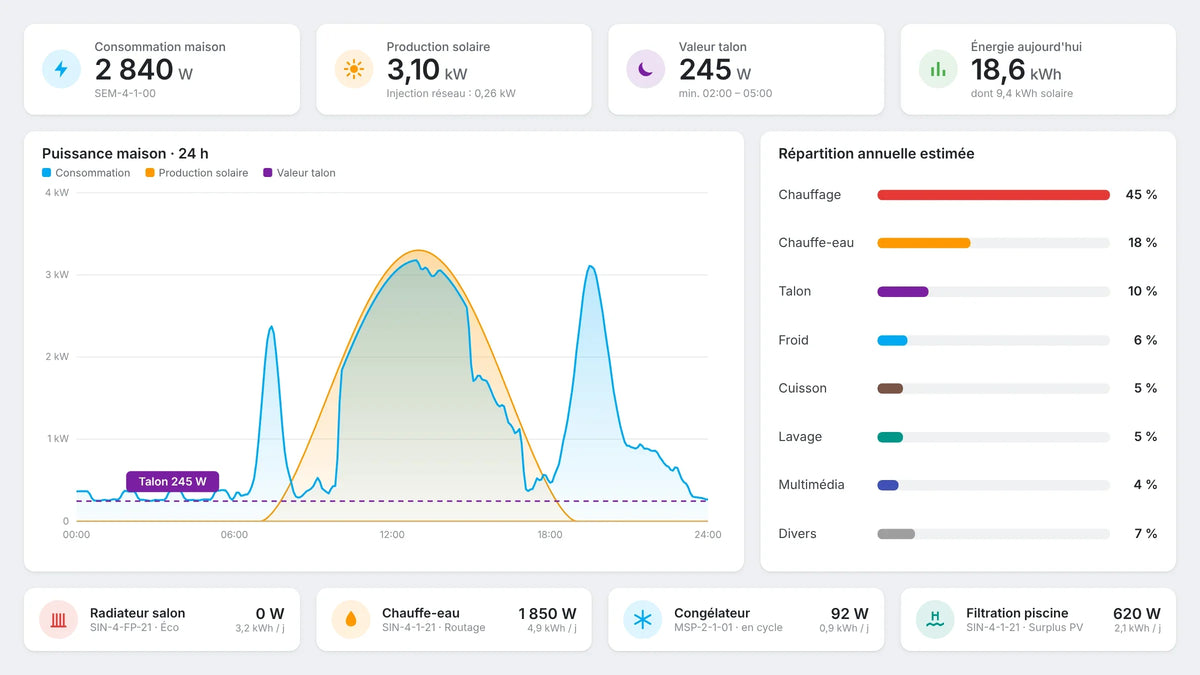
- With the SEM-4-1-00: the home's power is reported to Home Assistant in real time. The Energy dashboard then lets you track consumption day by day and month by month.
This meter stays in place throughout the measurement campaign. It is your reference.
Step 2: calculate your baseload
The baseload is the minimum consumption of the home when it is "at rest". What it consumes permanently, even when nobody is deliberately using an appliance: broadband router, fridge, ventilation, standby devices, home automation…
How do you measure it? Look at the power drawn in the middle of the night, between 2 am and 5 am. It is a very good approximation of the baseload.

In Home Assistant, a "24-hour minimum" statistics sensor based on the SEM-4-1-00's power reading even lets you track the baseload over time and spot any drift, for example an old freezer that starts running more often.
What orders of magnitude for 2 people?
- 100 to 200 W: a well-managed home;
- 200 to 300 W: typical, with more equipment;
- Above 300 to 400 W: it becomes worth hunting down the culprits.
The trap with the baseload is that it looks small at any given moment. But it never stops.
| Permanent baseload | Per day | Per year | Estimated annual cost* |
| 100 W | 2.4 kWh | 876 kWh | ~€175 |
| 200 W | 4.8 kWh | 1,752 kWh | ~€350 |
| 300 W | 7.2 kWh | 2,628 kWh | ~€525 |
* Based on around €0.20/kWh; adjust to your own tariff.
👉 The rule to remember: 1 W running continuously is 8.76 kWh a year. A 15 W broadband router therefore accounts for around 130 kWh a year.
Step 3: go round the appliances in 3 days
There is no need for one plug per appliance. With 2 or 3 plugs, you organise a little tour.
How long should each appliance be measured?
- Constant-load appliances (router, switch, TV on standby): 1 hour is enough;
- Cycling appliances (fridge, freezer, wine cooler): at least 24 hours, to smooth out the compressor cycles;
- Programme-based appliances (washing machine, dishwasher, tumble dryer): one complete cycle, ideally on the programme you use most;
- TV corner or home office: 24 hours on a power strip, to capture both use and standby.
Example schedule with 3 plugs:
| Plug 1 | Plug 2 | Plug 3 | |
| Day 1 | Fridge | TV corner (TV, set-top box, soundbar, console) | Washing machine (1 cycle) |
| Day 2 | Freezer | Home office (computer, screen, printer) | Dishwasher (1 cycle) |
| Day 3 | Wine cooler / 2nd fridge | Broadband router + network | Tumble dryer or microwave |
How do you turn a measurement into annual consumption?
- Permanent or cycling appliance: energy measured (kWh) ÷ measurement time (h) × 8,760. Example: a freezer that uses 0.9 kWh in 24 h → 0.9 ÷ 24 × 8,760 ≈ 330 kWh/year.
- Programme-based appliance: energy per cycle × number of cycles per week × 52. Example: a washing machine using 0.8 kWh per cycle, 4 times a week → 0.8 × 4 × 52 ≈ 165 kWh/year.
Once the appliances are equipped, a simple dashboard shows each one's power in real time. You can see at a glance what is running, and what shouldn't be.

What about appliances that don't plug into a socket?
Water heater, built-in oven, hob, radiators… They are wired directly to the consumer unit or draw too much power for a plug. Three solutions:
1. Measure at the consumer unit, circuit by circuit
The SEM-4-3-20 is installed in the consumer unit and monitors 3 circuits at the same time. It is very easy to install and ideal for large fixed loads: water heater, hob, oven, or a socket circuit in the garage or workshop. Unlike the plugs you move around, it stays in place and measures continuously.
2. Measure at the appliance, and control it
A module with metering, installed on the appliance's power supply, reports its consumption permanently and also lets you control it:
- the SIN-4-1-21 for a water heater, a boiler, a pool filtration pump, a heat pump…;
- the SIN-4-FP-21 for a pilot wire electric radiator.
These modules are not just for the measurement campaign: they are what will later make solar diversion, scheduling or load shedding possible (more on this below).
3. Measure by difference
The SEM-4-1-00 measures the whole home. Simply note the power before and after switching an appliance on:
- switching the hob on takes the home from 300 W to 2,300 W → the hob draws around 2,000 W;
- the water heater starts at night during off-peak hours → the jump in power gives its power rating, and the heating time gives its energy.
The case of electric heating: it is the hardest item to isolate, because it varies with the weather. Two approaches:
- Without equipment: compare monthly winter consumption with summer consumption, on the smart meter or the Energy dashboard. The difference corresponds, more or less, to heating.
- With SIN-4-FP-21 modules on pilot wire radiators: each radiator reports the energy it uses. You then know exactly which room costs the most to heat, and can check the effect of a setback or a schedule.
Step 4: draw up your energy audit
Once the measurements are complete, bring everything together in a table. Here is an example for a 2-person household:
| Item | Annual estimate | Share | When it is used |
| 🔥 Electric heating | 4,500 kWh | 45% | Winter, morning and evening |
| 🚿 Water heater | 1,800 kWh | 18% | Night (off-peak hours) |
| 🔌 Baseload (excluding refrigeration) | 1,000 kWh | 10% | 24/7 |
| 🧊 Fridge + freezer | 600 kWh | 6% | 24/7 |
| 🍳 Cooking | 500 kWh | 5% | Lunchtime and evening |
| 🧺 Laundry and dishes | 500 kWh | 5% | Variable |
| 📺 Entertainment (in use) | 400 kWh | 4% | Evening |
| ➕ Other (including lighting) | 700 kWh | 7% | Variable |
| Total | 10,000 kWh | 100% | ≈ €2,000/year |
To check your audit, simply compare the total with the annual consumption shown by your smart meter. If the difference exceeds 10 to 15%, an appliance has probably been missed.
In Home Assistant, the Energy dashboard does this ranking automatically, provided each measured appliance is declared in it.

Step 5: what should you put in place?
This is where measuring really pays off. Not every item calls for the same solution and, above all, when you consume matters as much as how much.
| What your measurements show | Possible action |
| A high baseload | Cut unnecessary standby, automate switch-offs at night or when away, replace an old appliance |
| A large water heater | Solar diversion: heat with surplus PV rather than during off-peak hours |
| Lots of programmable appliances | Shift the washing machine and dishwasher to daytime, when the panels are producing |
| Significant electric heating | Room-by-room scheduling, temperature setback when away, load shedding |
| Peaks close to the contracted power | Automatic load shedding, rather than upgrading your contract |
| Significant daytime consumption | Solar self-consumption becomes worthwhile |
| High night-time consumption | A battery can take over, charged with the surplus |
Reduce the baseload
This is often the most cost-effective lever, because every watt saved is saved 8,760 hours a year. A switched power strip for the TV corner, a plug or module controlled by Home Assistant to switch the home office off at night, and sometimes replacing an old freezer that uses two to three times more than a recent model.
The aim is not to switch everything off: the fridge, ventilation, router and home automation must stay on. It is about knowing what consumes power and why.
Size a solar installation
The audit tells you what share of consumption falls during the day. That is the share the panels can cover directly. Installing much more capacity than your daytime needs mostly means exporting your surplus to the grid at an unattractive rate.
Divert the surplus to the water heater
The water heater is the ideal candidate: a large consumer that stores energy as hot water. The principle, already covered in the article on MQTT: the SEM-4-1-00 detects the surplus, the home automation controller decides, and the SIN-4-1-21 switches the water heater on. A backup heat during off-peak hours guarantees hot water on days without sun.
To find out more: Controlling a water heater with the SIN-4-1-21: turning solar surplus into hot water
Size a battery
The baseload is a good basis for sizing storage. A 200 W baseload over 12 hours of night comes to 2.4 kWh, to which you add evening consumption (cooking, TV, lighting). The lower the baseload, the less battery capacity you need to get through the night.
Control heating better
With one SIN-4-FP-21 per radiator, each room receives its own pilot wire orders (comfort, eco, frost protection…) according to the time, occupancy or an open window. And because the module measures energy, you immediately see the effect of each setting on consumption, room by room.
Use the surplus for other purposes
The water heater is not the only candidate. With a SIN-4-1-21, the pool filtration can run primarily during solar production hours rather than on a fixed schedule. The same logic applies to other appliances that can be shifted without any loss of comfort.

Shed loads
The SEM-4-1-00 knows the power being drawn at all times. If it approaches the contracted power, an automation can temporarily switch off the water heater via the SIN-4-1-21, or set radiators to eco mode via the SIN-4-FP-21 modules. This avoids tripping the main breaker without having to upgrade to a higher-capacity contract, which costs more all year round.
Automate everyday life
The measurements are also useful day to day, once the campaign is over:
- a notification at the end of the washing machine cycle, detected by the drop in power;
- an alert if the freezer runs for an abnormally long time;
- a suggestion to start the dishwasher when the panels are producing.
My case: a heavily measured laboratory
Personally, I am well above average. But there is a good reason: my home is a genuine connected laboratory, with far more equipment than most households. My baseload ranges between 350 and 500 W. Here is how it breaks down:
| Item | Average estimate |
| 🧊 Fridge + freezer | 80 W |
| 🏡 Chalet / lab | 130 W |
| 💨 Ventilation | 60 W |
| 🔀 24-port switch + network equipment | 35 W |
| 📡 4 Wi-Fi access points | 25 W |
| 🌐 Broadband router + associated equipment | 20 W |
| 🖥️ Home Assistant server | 10 W |
| 📺 2 LED TVs on standby + alarm | 10 W |
| 🔌 60 mains-powered connected devices | 60 W |
| ➕ Other appliances… | 50 W |
| Estimated total | 480 W |
One figure pleased me: my 60 mains-powered connected devices only use around 60 W in total, barely 1 W each. Home automation itself weighs almost nothing in the baseload. It is the lab and the network that push the figure up.
Yet this high baseload costs me very little. During the day, it is fully covered by solar production. At night, my Zendure battery takes over, also charged with the day's surplus. In fact, it was this baseload that I used as the basis for sizing the storage: 480 W over about twelve hours comes to around 6 kWh to cover, before even counting the evening.

Key takeaways
✔ No need for 50 plugs: one meter in the consumer unit and 2 to 3 plugs with metering are enough
✔ The baseload can be read from the home's consumption between 2 am and 5 am
✔ 1 W running continuously is 8.76 kWh a year
✔ 24 hours of measurement for a cycling appliance, one complete cycle for a programme-based appliance
✔ Fixed appliances are measured on their circuit (SEM-4-3-20), at the appliance (SIN-4-1-21, SIN-4-FP-21) or by difference
✔ Modules with metering are then used for control: diversion, scheduling, load shedding
✔ The audit shows how much you consume, but also when: that is what points towards solar, a battery, diversion or load shedding
Products mentioned
- SEM-4-1-00 – Zigbee Smart Energy Monitor
- SEM-4-3-20 – Zigbee 3-Circuit Energy Meter
- SIN-4-1-21 – Zigbee Multifunction Relay Switch with Metering
- SIN-4-FP-21 – Zigbee Pilot Wire Heating Module with metering
- MSP-2-1-01 – Micro Smart Plug + Metering EnOcean
In the same series
- Building a Residential EMS with Home Assistant and NodOn Zigbee Products
- Measuring energy flows with the SEM-4-1-00
- Optimizing photovoltaic self-consumption with Home Assistant
- Controlling a water heater with the SIN-4-1-21: turning solar surplus into hot water
- Understanding MQTT: the invisible language of the connected home
- NodOcean for HA: NodOn EnOcean products in Home Assistant, hassle-free
 About the author – eHome Labs
Passionate about home automation for over 20 years, Pascal Stephany evolves his installation in step with his experiments. Each automation is tested in real conditions before being adopted daily, making his home a true life-size laboratory.

Leave a comment
This site is protected by hCaptcha and the hCaptcha Privacy Policy and Terms of Service apply.